Key Takeaways:
- Ethereum struggled near $2,850 and trimmed most gains.
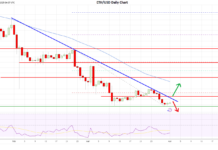
- ETH/USD is still well below a major bearish trend line with resistance at $3,000 on the daily chart.
- The price could see a downside thrust toward $2,000 before the bulls take a stand.
Ethereum (ETH) price is showing bearish signs below $2,800 and the 50-day simple moving average (blue). It might extend losses if it breaks $2,300.
Ethereum Price Turns Red Below $2,800
In August 2024, Ethereum price saw a recovery wave from the $2,100 level like Bitcoin. There was a move above the $2,350 and $2,450 resistance levels. The bulls even pumped the price above the $2,500 resistance.
However, the price failed to clear the $2,800-$2,850 resistance region. The bears remained active near the 50% Fib retracement level of the downward wave from the $3,566 swing high to the $2,099 low.

Ethereum failed to settle above the 50-day simple moving average (blue) and started another decline. There was a steady decline below the $2,650 and $2,550 support levels. ETH trimmed most gains from $2,099 and retested the $2,300 support zone.
The price is now consolidating near the $2,400 level. On the upside, the price could face hurdles near the $2,600 level. The first major resistance sits near the $2,800 level and the 50-day simple moving average (blue).
The next resistance is near the $3,000 level. There is also a major bearish trend line forming with resistance at $3,000 on the daily chart. It is close to the 61.8% Fib retracement level of the downward wave from the $3,566 swing high to the $2,099 low.
A clear move above the $3,000 level could open the doors for a move toward the $3,220 level. If ETH bulls push the price above the $3,220 resistance, there could be a steady increase. In the stated case, the price could rise toward the $3,550 level. Any more gains might initiate a move toward the $3,800 zone.
More Downsides In ETH?
Conversely, Ethereum might extend losses below the $2,350 level. Immediate support is near the $2,300 level. The first major support sits near the $2,220 level. The next major support sits near the $2,100 level. A daily close below the $2,100 level might send ETH toward the $2,000 support.
A clear downside break and close below the $2,000 support zone could initiate a larger decline. The next major support is near the $1,880 level. Any more losses might send Ether toward the $1,750 support.
Overall, Ethereum price is showing bearish signs below $2,650 and $2,800. A close below $2,300 could send the price toward $2,100 or even $2,000 in the coming weeks.
The post Why Ethereum (ETH) Price Could Nosedive Before A Strong Recovery Kicks In appeared first on CoinChapter.


