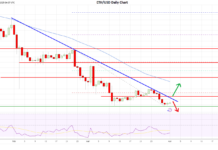
NEW DELHI (CoinChapter.com) — Ethereum (ETH) prices have rebounded with the broader crypto market, but bearish risks remain for the prime altcoin.
With macro headwinds diminishing any chances of an extended rally, it is unlikely ETH price’s outlook will turn bullish anytime soon. The token is struggling to break above $1,400 after falling below the price level in Sept.
A $900 Price Target Possible
In addition, ETH prices have formed a bearish pattern called the bear pennant.
Pennants are continuation patterns. They form when a period of consolidation with converging trendlines follows a large movement in a cryptocurrency’s prices. Then, the asset breaks out in the same direction as the large initial movement.
Volumes play an important role in verifying the pattern. Per the rules of technical analysis, consolidation should occur with lower volumes, while higher volumes should accompany breakouts.

However, to confirm the pattern, Ether volumes need to move up. Otherwise, the prime altcoin would continue to consolidate below $1,400. For a bear pennant pattern, traders calculate the price target by applying the initial flagpole’s height to the point where the price breaks out from the pennant.
Also Read: ETH/BTC: Ethereum Price Highly Bullish Vs Bitcoin Above This Crucial Support
Hence, Ether prices could fall to $908, nearly 33% from current price levels.
Ether Price Chart
ETH prices have started the week on a positive note, jumping nearly 7.5% to reach an intraday high of $1,360 on Tuesday from Oct 3’s low of $1,265. However, the token’s 20-day exponential moving average (20-day EMA, red wave) continues to rebuff ETH price action.
If Ether prices move above the 20-day EMA resistance, the token would likely target resistance near $1,430, which has previously supported ETH price action between Jul 27 and Sept 18 this year.
A move above $1,400 could provide ETH the momentum to challenge resistance above its 50-day EMA (purple wave) near $1,516 before paring gains.

Conversely, if the Ethereum token’s current momentum fizzles out, the crypto token could end up testing support near $1,270, which previously acted as resistance for Ether between Jun 14 and Jul 15.
If ETH confirms the bear pennant, the token might fall to $1,200 before attempting any recovery. Meanwhile, the relative strength index for ETH remains neutral, clocking at 44.96 on the daily charts.
At writing, ETHUSD was trading at $1,350, up 2.05% on the day.
Bitcoin holders are on a buying spree as BTC offers “discounts.” Read more about it here
The post Ethereum prices remain lifeless as ETH paints bearish pattern appeared first on CoinChapter.


