Key Takeaways:
- Ethereum struggled to climb above the $2,720 resistance zone.
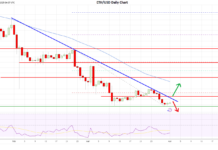
- ETH/USD is well below a key bearish trend line with resistance at $3,200 on the daily chart.
- The price could start another decline if it stays below the $2,720 and $2,820 resistance levels.
NEW DELHI (CoinChapter.com) — Ethereum (ETH) is struggling below $2,820 and the 50-day simple moving average (blue). ETH is at risk of a fresh drop to $2,200.
Ethereum Price Faces Rejection Near $2,720
In the last technical analysis, we discussed why Ethereum must avoid a weekly close below the $2,000 support. The bulls managed to protect the $2,000 support and the price started a recovery wave like Bitcoin. There was a decent upward move above the $2,250 and $2,350 levels.
The price climbed above the 23.6% Fib retracement level of the downward move from the $3,548 swing high to the $2,099 low. The bulls even pushed the price above the $2,550 resistance zone. However, the bears were active below the $2,800 zone, and the price stayed well below the 50-day simple moving average (blue).

Ethereum faced heavy resistance near the $2,720 level. The last 3-4 daily candles suggest that ETH is losing steam and might start another decline. If the bears remain in action, the price could slip again.
Immediate support is near the $2,500 level. The first major support sits near the $2,450 level. The next major support sits near the $2,320 pivot level. A daily close below the $2,320 level might send ETH toward the $2,120 support.
The main uptrend support is now near the $2,000 region (a multi-touch zone). A clear downside break and close below the $2,000 support zone could spark a larger decline. The next major support is near the $1,750 level. Any more losses might send Ether toward the $1,550 support.
More Upsides In ETH to $3,000?
Conversely, Ethereum might stay above the $2,500 support and start another increase. On the upside, the price could face hurdles near the $2,650 level. The first major resistance sits near the $2,720 level. The next resistance is near the $2,820 level or the 50% Fib retracement level of the downward move from the $3,548 swing high to the $2,099 low.
A clear move above the $2,720 level could open the doors for a move toward the $3,000 level. The main downtrend resistance is now forming near the 50-day simple moving average (blue) at $3,200. On the daily chart, there is also a key bearish trend line in place with resistance at $3,200.
If ETH bulls push the price above the $3,200 resistance, there could be a steady increase. In the stated case, the price could rise toward the $3,320 level. Any more gains might initiate a move toward the $3,550 zone in the near term.
Overall, Ethereum price is struggling to gain bullish momentum above $3,720 and $3,820. If it remains below $2,720 for a long time, the bears might aim for a move toward $2,000.
The post Ethereum (ETH) Faces Downside Pressure: Is a New Drop Imminent? appeared first on CoinChapter.


