YEREVAN (CoinChapter.com) — Bitcoin ($BTC) has historically seen notable price shifts during the December holiday season, influenced by macroeconomic conditions, market sentiment, and global events.
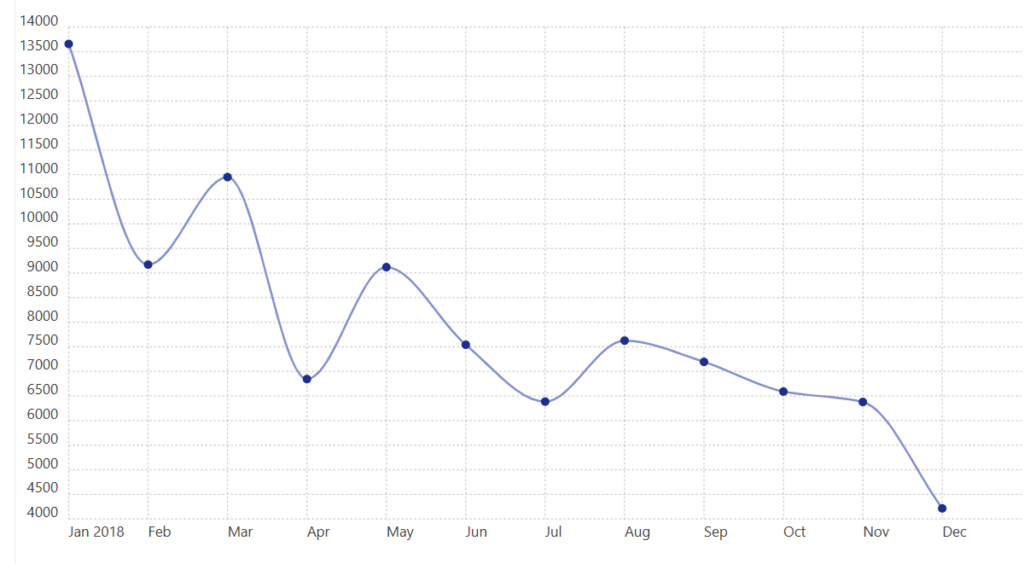
Bitcoin faced a steep decline during December 2018, dropping to a yearly low of $3,200. The market correction followed the end of the previous bull cycle. Weak investor sentiment and broader market sell-offs defined this period. Bitcoin struggled to recover as it entered a prolonged bearish phase.
By December 2019, Bitcoin attempted to rebound, trading near $7,200. However, the price remained far below its 2017 peak, signaling that the market had yet to regain significant momentum.
December 2020 and 2021: Bitcoin Peaks and Corrects
In December 2020, BTC surged to around $29,000 during the holiday season. Growing institutional adoption and rising interest in cryptocurrencies supported the rally. Bitcoin’s performance in 2020 reflected increased confidence in digital assets, particularly from institutional investors.
In contrast, December 2021 saw BTC drop to $50,000 after hitting an all-time high of $68,789 the previous month. Analysts attributed the decline to the Federal Reserve’s tightening monetary policy and profit-taking. These factors pressured the market, leading to a shift in investor sentiment.

December 2022: FTX Collapse Impacts Bitcoin
December 2022 presented another challenging period for Bitcoin. Following the collapse of FTX, one of the largest cryptocurrency exchanges, Bitcoin dropped to $15,477 in November. The market experienced panic, causing a widespread sell-off.
By Christmas, Bitcoin stabilized at $16,537. Despite a slight recovery, the year recorded a 64% drop in Bitcoin’s value compared to 2021. The market remained fragile, highlighting the impact of external events on Bitcoin’s performance.
December 2023: Stability and Recovery
In December 2023, Bitcoin regained momentum. It started the year at $16,537 and climbed to a high of $44,697. During the holiday season, Bitcoin traded steadily between $42,000 and $44,000. Slower interest rate hikes by the Federal Reserve contributed to this recovery.

December 2024: Bitcoin Reaches New Heights
As of Dec. 17, 2024, Bitcoin peaked at $108,000 before stabilizing around $104,131. Institutional demand has played a significant role this year, with over $600 million flowing into U.S. Bitcoin ETFs.

Major holders purchased 150,000 BTC at an average price of $98,133, establishing a new support level. For example, analysts like Ali Charts suggest BTC could see corrections after reaching $110,000. Predictions indicate further milestones, such as $125,000 by year-end, with possible corrections to $96,000 in the short term.

Bitfinex analysts emphasized that corrections in 2024 are likely to be less severe compared to previous cycles. They project that BTC could maintain stability above $100,000, even amid market fluctuations, as the ETF market matures and investor confidence grows.


