

NOIDA (CoinChapter.com)— Bitcoin (BTC) price recently experienced a period of consolidation, with price action fluctuating within a narrow range. While the market appears to be taking a hiatus, discussions around the halving event from April 2024 continue.
Historically, halving events have triggered significant price movements. However, the focus remains on how the current cycle compares to previous ones and when Bitcoin’s next bull run could ignite.
Bull Run Timing and Cycle Analysis
According to a tweet by Quinten François, historical Bitcoin cycles indicate that the market tends to enter a bullish phase approximately 170 days after a halving, with a peak occurring 480 days post-halving. François noted that the market was about 148 days into the cycle.
Based on past trends, this puts the BTC price just weeks away from the potential beginning of a new bull run.
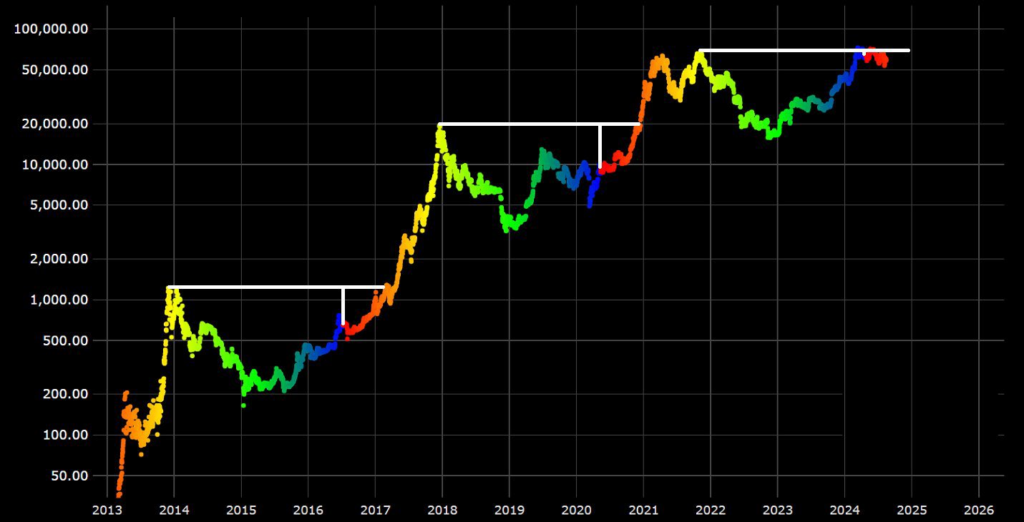
The analyst shared a chart highlighting Bitcoin’s price history across different halving cycles. Historically, Bitcoin’s price surges following each halving, breaking previous all-time highs before reaching a peak. The pattern remains consistent across multiple halving cycles, reinforcing the belief that the market operates in predictable phases.
One user responding to the tweet provided a more precise timeline, predicting the start of the next bullish phase around Oct. 6, 2024, and a peak around Aug. 12, 2025.
The prediction is based on block height data and previous cycle behaviors. If Bitcoin follows this timeline, it suggests the market could see gradual price appreciation leading up to the predicted peak.
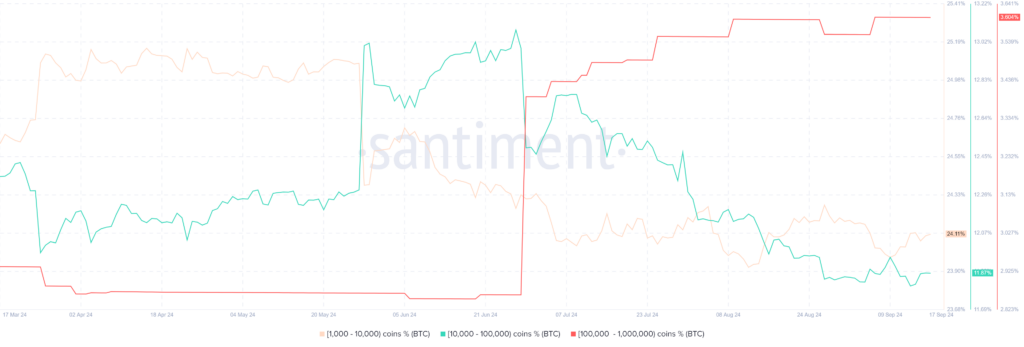
Additionally, a Santiment chart analyzing whale wallet activity shows minimal movement from large holders but more fluctuation in mid-range wallets. These mid-range whales seem to be accumulating, indicating growing confidence in the market’s future potential and reinforcing the expectations for a bull run.
This alignment of historical data, whale accumulation, and halving cycles suggests that Bitcoin could soon enter a new phase of bullish momentum.
BTC Price Forms Bullish Setup
The BTC USD pair has formed a bullish technical setup called the ‘bull flag pattern.’
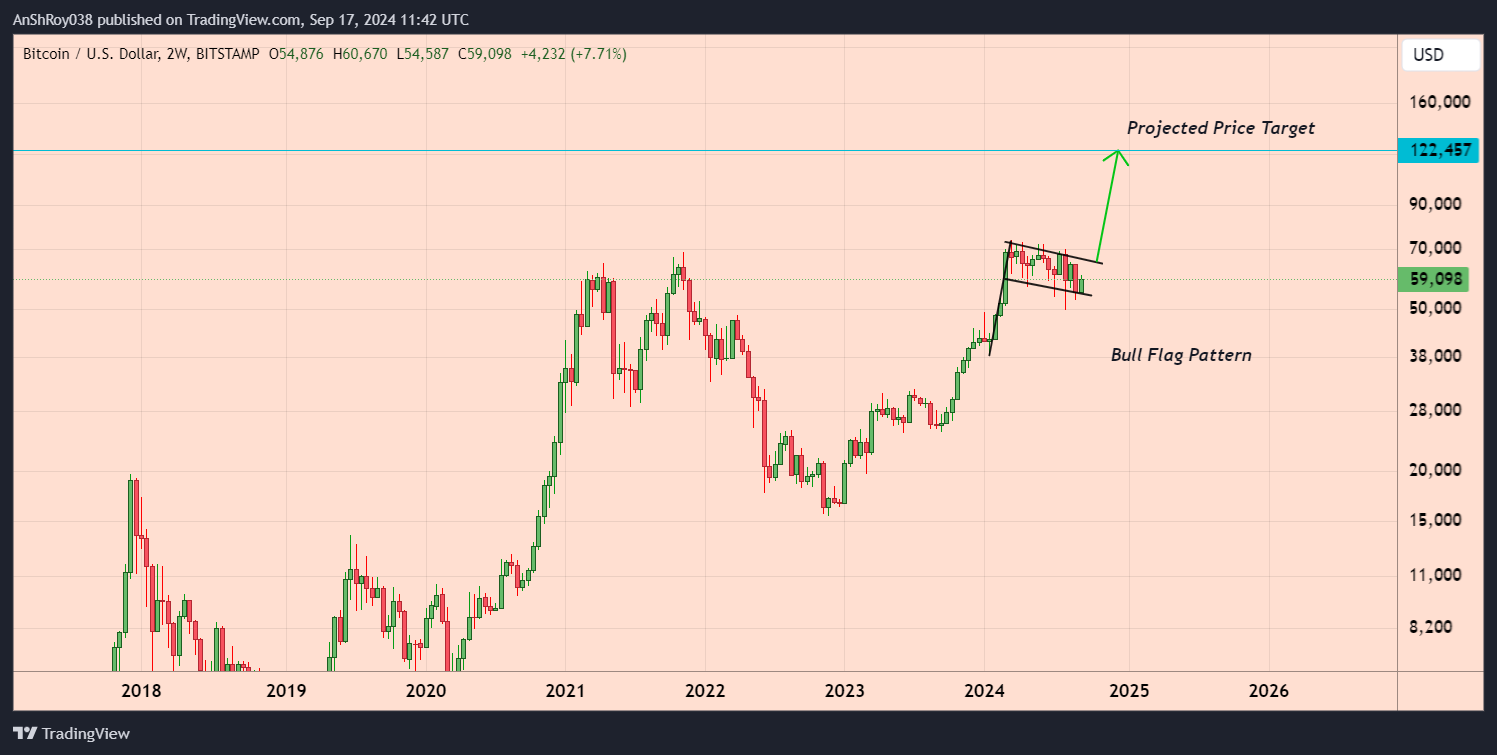
A bull flag pattern forms when a crypto token’s price experiences a near-vertical rise, creating the flag pole. This pattern commonly emerges in assets that are in a strong uptrend.
Following the steep ascent, the asset undergoes a period of consolidation, which creates the flag of the pattern. Despite the initial strong rally, the price holds steady as buying pressure persists. Typically, a breakout from this consolidation phase triggers another significant uptrend.
The pattern reaches completion when the price breaks out from the flag area, effectively resuming the prior upward trajectory. Traders project the breakout’s price target by adding the length of the flag pole to the breakout price level.
According to the rules of technical analysis, if the token confirms the bullish technical pattern, the BTC USD pair might rally over 107% to reach the pattern’s theoretical price target near $122,450
It is unlikely that the token will reach the pattern’s target price immediately after confirming it, but a breakout could help attract more buyers to the market.
The post Bitcoin (BTC) Price Nears Critical Point as Halving Cycle Hints at Upcoming Bull Run appeared first on CoinChapter.

 At A Tipping Point – Will Resistance Give Way To A Major Surge?")