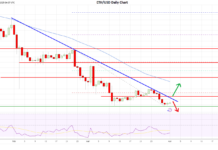
Ethereum (ETH) has been struggling to find momentum recently, declining steadily against Bitcoin (BTC). Jump Trading’s sell-off during Aug. 2024 could be a key factor behind this downtrend. Crypto analyst Michaël van de Poppe shared his views on the ETH/BTC pair, stating the trading pair’s price chart was ‘disgusting.’
Despite ongoing fundamental improvements, the weakening ETH/BTC ratio raises concerns about Ethereum’s long-term competitiveness against Bitcoin.
ETH Stumbles as BTC Dominates: Key Drivers Behind the Drop
The ETH/BTC pair has shown significant weakness over the past few weeks, highlighting Ethereum’s inability to outperform Bitcoin despite various developments in the Ethereum ecosystem.
According to Michaël van de Poppe’s analysis, Ethereum has faced repeated rejection at critical resistance levels, notably around 0.04622 BTC and 0.05151 BTC. These areas have acted as strong ceilings, with sellers stepping in each time ETH approaches these zones.

Despite various fundamental improvements in the Ethereum ecosystem, the market remains unconvinced of ETH’s ability to break out. The pair is now testing a significant support zone near 0.0400 BTC, and failure to hold this level could lead to deeper declines.
Moreover, the declining ETH/BTC pair signals a broader market trend where Bitcoin is consolidating its dominance, potentially driven by upcoming macroeconomic events.

Furthermore, institutional interest in Bitcoin has grown, as evidenced by the massive inflow in BTC investment vehicles. Bitcoin’s $1.07 billion weekly inflows overshadow Ethereum’s $86.9 million, showing Bitcoin’s continued investor preference.
While Bitcoin’s month-to-date (MTD) flows stand at $1.15 billion, Ethereum faces a significant outflow of $60.3 million. It seems market participants view Bitcoin as a safer bet during volatile periods while Ethereum struggles to retain investor confidence.
The global macro cues, including inflation concerns and geopolitical tensions in the Middle East, have added complexity to the crypto markets, with risk-off sentiment favoring Bitcoin over Ethereum.
Michaël van de Poppe also highlighted the importance of Ethereum holding its support levels. If ETH breaks below 0.0400 BTC, it could signal further downside, leading to increased selling pressure and deeper corrections.
ETH USD Pair Forms Bullish Setup
While the ETH BTC pair is not feeling so hot, the ETH USD pair has formed a bullish technical setup called the ‘falling wedge.’
A potential bottom in Ethereum’s price in ETH/BTC could lead to ETH outperforming Bitcoin. The ETH USD pair has also formed a bullish wedge pattern, the theoretical target of which could set a new ATH for the token.

A falling wedge pattern features a pair of converging trend lines connecting lower highs and lower lows, forming a narrowing shape that slopes downward.
The pattern indicates that an asset’s price while consolidating in a downtrend, is losing bearish momentum and preparing for a potential reversal to the upside. Typically, a breakout occurs upward, in line with the overall trend.
To estimate the price target, traders measure the widest part of the wedge at the beginning and project this distance upward from the breakout point. Moreover, a higher trading volume during the breakout confirms the reversal’s reliability, indicating stronger market conviction and a higher likelihood of success.
According to technical analysis rules, the ETH-to-USD conversion rate might rally nearly 127% from its current level to reach the pattern’s projected target of nearly $5,400.
The post Analyst Terms ETH BTC Performance “Disgusting” As Pair Fails To Find A Bottom appeared first on CoinChapter.


