Most altcoins are struggling to recover after the recent fall in the price of Bitcoin.
The prices of Safemoon (SAFEMOON), Dogecoin (DOGE) and Ravencoin (RVN) suffered brutal losses during the crypto crash this week. Most altcoins followed the fall in the price of Bitcoin, which reached highs of $52,000. Safemoon’s price hit a floor of $ 0.00000154, Dogecoin tested a seven-day floor at $ 0.24 and Ravencoin slipped to $0.11.
Price of Safemoon
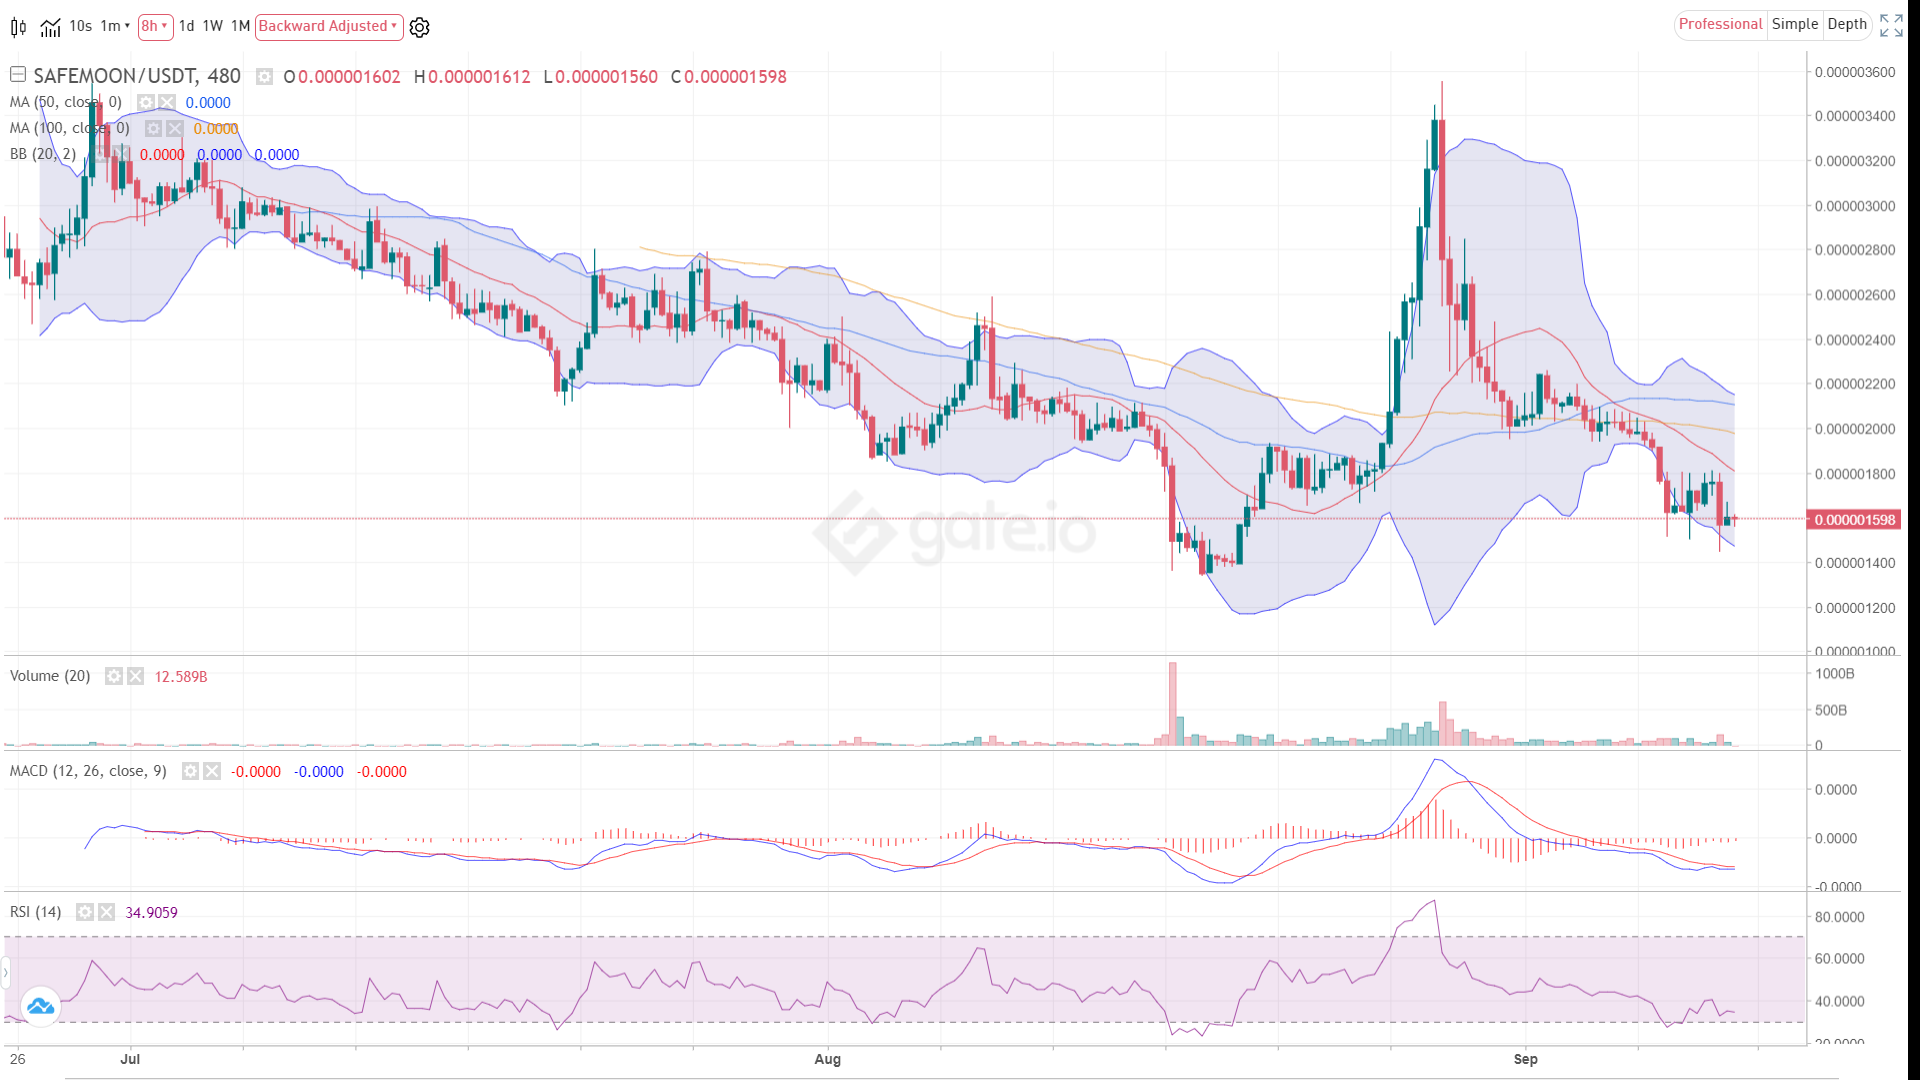
SAFEMOON touched an intraday low of$ 0.00000151, with the drop being caused by the recent crash of cryptocurrencies. The price is now below the simple moving averages of 50 and 100 on the 8-hour chart.
The bearish outlook for SAFEMOON’s price is accentuated by the plunge towards the Bollinger bands support curve. The RSI and MACD are also trending negatively to add credit to this outlook.
If the price breaks down, the next support would be around the $ 0,00000134 area.
SAFEMOON / USDT chart over 8 hours. Source : Gate.io
On the upside, SafeMoon bulls face tough hurdles at the median Bollinger bands curve ($0.00000181) and then the SMA 100 at $0.00000198.
Price of Dogecoin
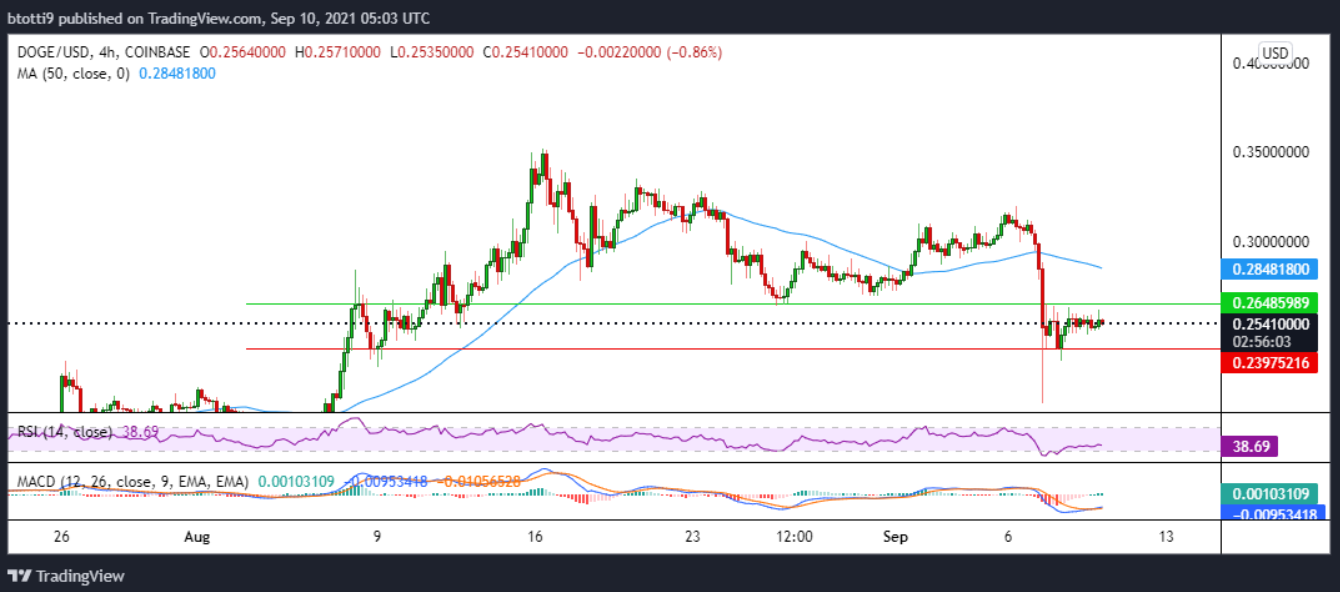
The price of Dogecoin is trending just in the green on the 4-hour chart, with the potential for a sustained reversal, hinted at by the bullish cross of the MACD over 4 hours. The increase must cross resistance at $ 0.26 (horizontal green line) for a scenario that will allow a new target at the ADM 50 level ($0.28).
Currently, this prospect faces a key hurdle at $ 0.25, with an ascending triangle configuration that hints at further losses. The RSI below the 50 mark and the sloping SMA curve of 50 add to this probability.
If the DOGE / USD pair breaks down, the bulls can count on initial support around $0.24. However, the price could fall to lows of $0.20.
DOGE/USD chart over 4 hours. Source : TradingView
Check out our how to buy Dogecoin page here
Price of Ravencoin
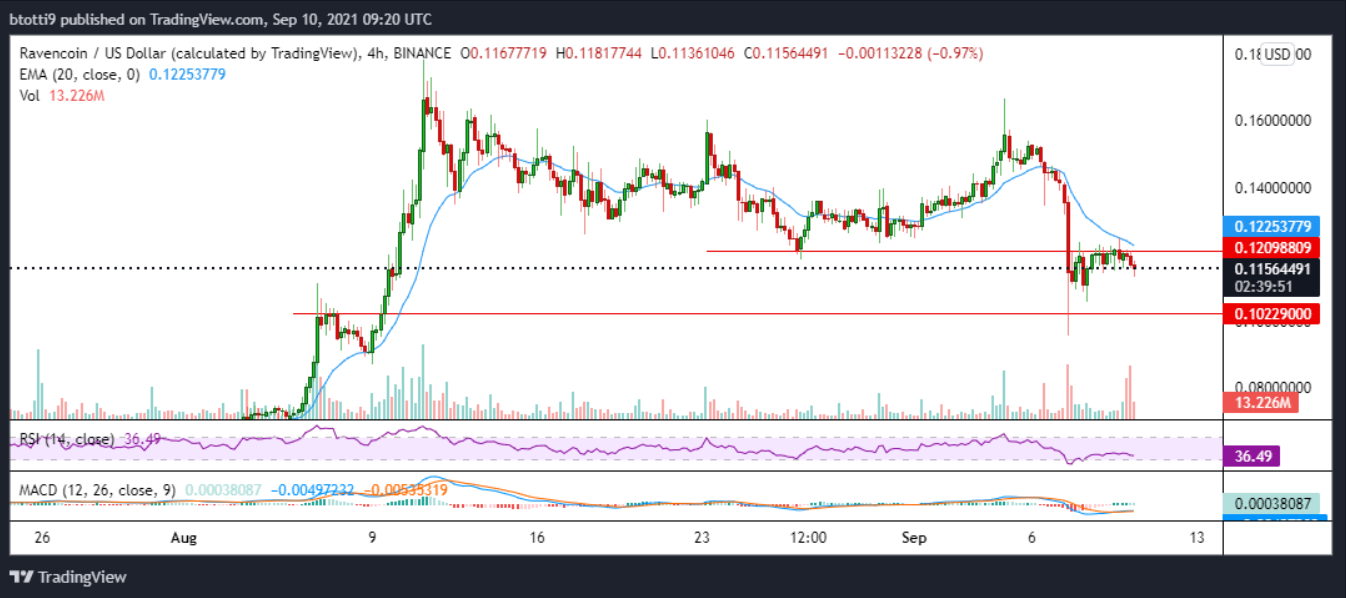
RVN’s price is currently capped at nearly $ 0.12 on the 4-hour data chart, and bullish attempts to break above the barrier are not helped by the massive selling pressure, as evidenced by the increase in sales volume.
The drop in the RSI below the equilibrium level and the negative outlook for the 20 EMA curve suggest that the path down is more likely over the next few days. In this case, RVN/USD could drop to support levels around$0.10.
On the upside, the MACD suggests that the upside has its chances. If RVN / USD breaks above the highlighted horizontal barrier, sustained momentum above the 20 EMA ($0.12)would open bids at $ 0.13 and $ 0.14.
4-hour RVN/USD chart. Source : TradingView


