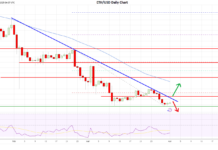
NOIDA (CoinChapter.com) — Ethereum price have been volatile recently as the ETH token fell below $2,500 after a few days of continuous downtrend. Despite fluctuations, ETH’s resilience reflects the strength of its ecosystem, with investors eyeing potential bullish signals.
As U.S. election dynamics influence market sentiment, Ethereum’s performance will likely draw increased attention, especially with ongoing institutional adoption and rising interest in decentralized applications.
On-Chain Charts Show Bullish LTH Sentiment
Recent Ethereum charts showcase some promising trends for bullish investors. Ethereum’s net transfer volume to and from exchanges showed strong outflows from exchanges, with more ETH moving to private wallets.

The trend often suggests accumulation by investors who prefer long-term holdings over trading, hinting at confidence in ETH’s future appreciation. Notably, consistent large red bars in the chart reflect significant outflows, a positive signal for those looking for potential price stability or growth.

Furthermore, Ethereum’s Futures Long Liquidations Dominance chart shows a high dominance of long liquidations.
The reset in leveraged positions decreases market susceptibility to sudden crashes. A reduction in over-leveraged longs can pave the way for a more sustainable bullish trend, as it clears weaker hands from the market.
The declining dominance of liquidations post-spike implies growing stability, with fewer forced sell-offs on price dips.

Moreover, the Long-Term Holder Net Unrealized Profit/Loss (NUPL) for ETH holders reflects a shift towards neutral or slight profit-taking by long-term holders, but without extreme losses.
Historically, long-term holders maintain their positions unless confidence wanes significantly. This moderate profit range may suggest that long-term holders anticipate potential gains, contributing to a cautiously bullish sentiment in Ethereum’s price trajectory.
US Elections And Bitcoin Relation Could Impact Ethereum’s Path Forward
The U.S. election has drawn Bitcoin into an unusual correlation with political sentiment, with analysts suggesting that a Trump victory could buoy BTC prices, while a Harris win might trigger a BTC sell-off.
Miles Deutscher’s recent comments emphasized the trend, highlighting that Bitcoin’s price appears tightly linked to Trump’s election odds. If BTC plummets under a Harris victory, Ethereum could face initial pressure, given its historical correlation with Bitcoin.

However, Ethereum’s evolving ecosystem, with institutional backing and unique utilities in decentralized finance and tokenization, could provide it with a degree of resilience. While Ethereum might initially follow Bitcoin’s reaction, its long-term value drivers could potentially help it stabilize faster.
A favorable political outcome for Bitcoin may catalyze a similar response for Ethereum, but its differentiated role in blockchain innovation might cushion it from broader volatility, especially if institutional engagement continues.
Bullish Pattern Could Attract More Buyers
Meanwhile, the ETH USD pair has formed a bullish technical setup, called the ‘falling wedge‘ pattern.

Two converging downward trendlines that connect lower highs and lower lows form the falling wedge, a bullish reversal. The narrowing structure shows that, despite the ongoing downtrend, the bearish momentum is gradually weakening, often preceding an upward breakout.
The key feature of a falling wedge is that the slope of the lower trendline is steeper than that of the upper trendline, indicating that selling pressure is dissipating. When the breakout occurs—typically upward—it signals buyers taking control.
To estimate the potential price target after a breakout, traders measure the vertical distance between the widest points of the wedge and project that range from the breakout point upwards. Increased trading volume during the breakout confirms the strength of the reversal, reinforcing market confidence and the likelihood of success.
According to technical analysis rules, the ETH USD conversion rate might rally nearly 113% from its current level to reach the pattern’s projected target of around $5,230.
The post Ethereum Bulls Eye Breakout Amid U.S. Election Drama and Growing LTH Confidence appeared first on CoinChapter.


