

NOIDA (CoinChapter.com) — Ethereum (ETH) has recently shown signs of bullish momentum, moving laterally near $2,600. A rally for the Ethereum token could help herald the advent of the altcoin season, especially as Bitcoin price has started an upward movement.
As traders eye key resistance levels, whispers of a potential breakout raise optimism in the crypto space.
Technical Analysis of IncomeSharks’ Tweet Chart
A post by an independent crypto analyst going by the moniker ‘IncomeSharks‘ on X highlighted critical resistance and support levels that could determine ETH’s next move. ETH is trading just below $2,700, a key resistance zone marked by a descending trendline.
The level has historically acted as a rejection point, and if it is not broken through, ETH could drop back to $2,400.
However, the ascending pattern formed by higher lows signals growing bullish momentum. When combined with declining resistance, this structure typically precedes a breakout. The tweet predicts ETH will rally to $3,000 if it breaks through the descending trendline.
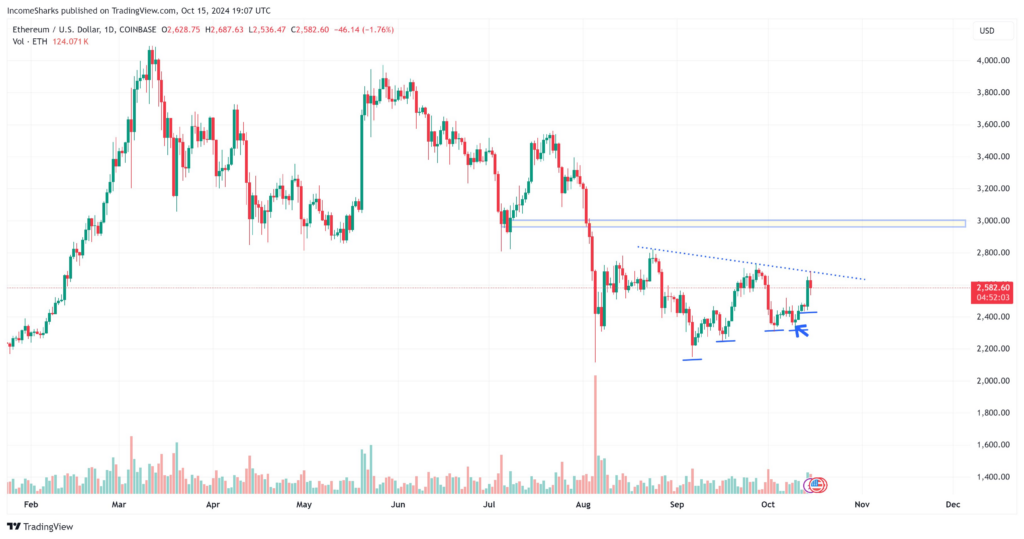
From a technical standpoint, the next significant resistance would likely be around $3,000, a level seen back in May-June.
Volume analysis shows moderate buying activity but lacks the spike associated with large-scale institutional movement. This indicates that retail traders are driving the current price action, and any move beyond $2,700 must be accompanied by a substantial increase in volume to confirm a sustained breakout.
Though the ETH price is approaching a critical resistance zone, a breakout above $2,700 is vital to gaining toward $3,000.
ETH Price Faces EMA Resistance
Meanwhile, the ETH USD pair faced resistance from the 100-day EMA (blue) trendline, a dynamic resistance level that has troubled Ethereum prices since late July earlier this year.
The EMA trendline rebuffed ETH’s upside attempt again on Oct. 17, forcing the token to recede after an earlier spike of 2% helped Ether reach a daily high near $2,647.
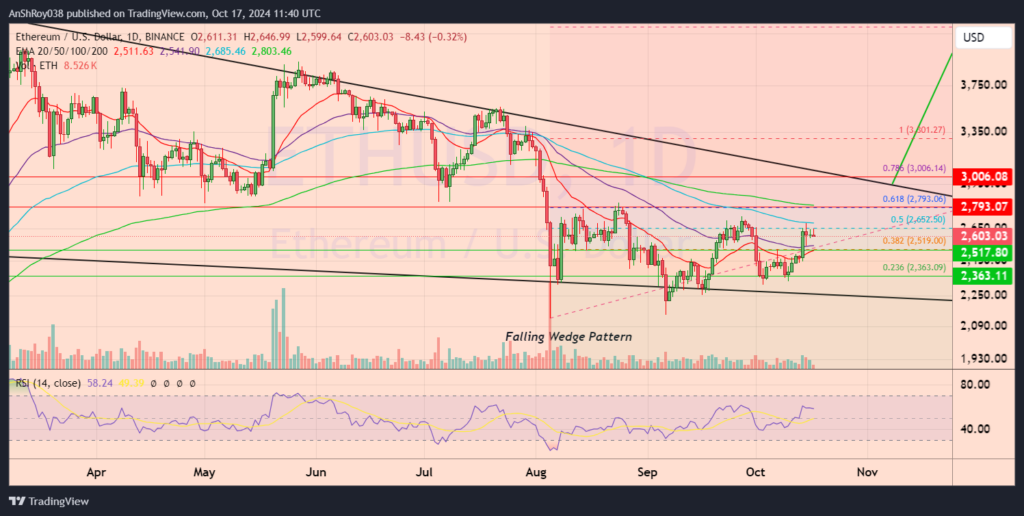
Breaking above the 100-day EMA would bring the ETH USD pair close to the 200-day EMA (green) resistance near $2,790. Breaking and consolidating above the immediate resistance would help ETH price target the resistance near $3,000, close to the falling wedge‘s upper trendline that the token is moving inside.
A rally to $3,000 would raise traders’ hopes of a bullish breakout from the technical setup, which could attract more buyers.
Conversely, a reversal from here would see the ETH price drop to the 20-day EMA (red) support near $2,510. Failure of immediate support could force the Ethereum token price to support near $2,360 before recovering.
The RSI for ETH remained neutral, with a score of 58.24 on the daily charts.
The post Ethereum’s Path to $3,000 Hinges on Key Resistance Levels appeared first on CoinChapter.
 Make-or-Break Moment — Break Resistance or Drop?")
 Wobbles: Is This The Start of A Bearish Spiral?")
