

Key Takeaways:
- Bitcoin started a fresh increase above the $65,500 resistance.
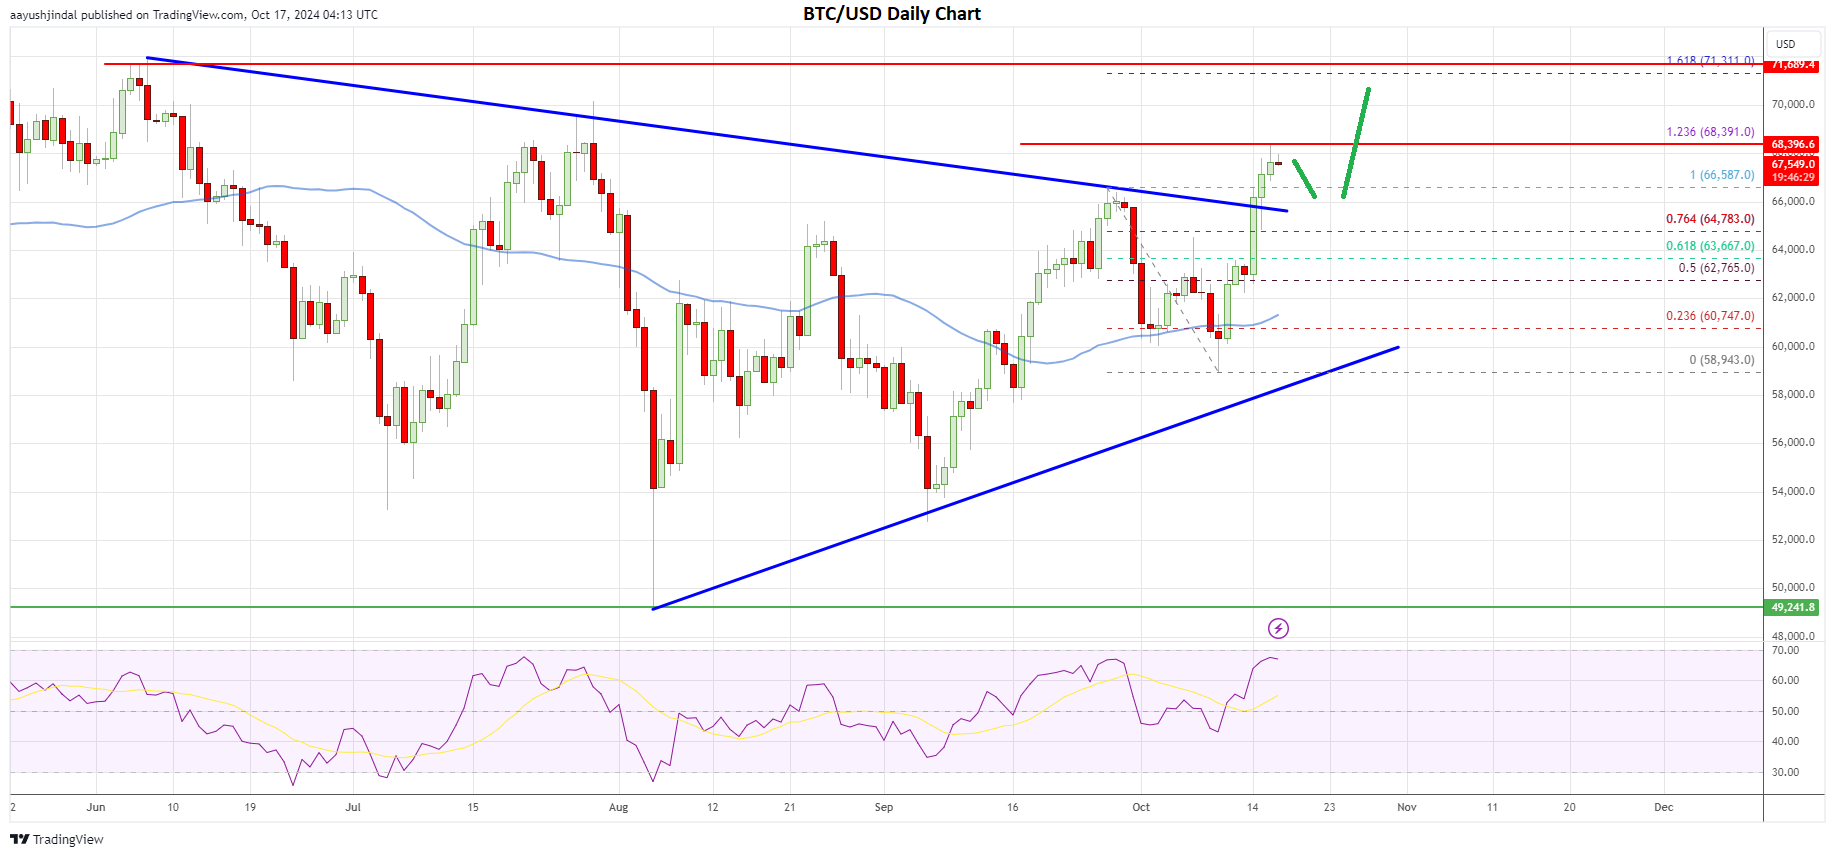
- BTC/USD cleared a key bearish trend line with resistance at $66,200 on the daily chart.
- The price is now well above the 50-day simple moving average (blue) and signaling an upside break.
Bitcoin price gained pace above $65,000 and $66,000. BTC is showing bullish signs and might aim for more upsides above $68,800.
Bitcoin Price Sights Fresh Surge Above $70K
In the past few days, Bitcoin price saw a decent upward move above the $64,500 resistance zone. BTC was able to clear a few hurdles near $65,000 and $65,500. It even settled above the $65,000 pivot level and the 50-day simple moving average (blue).
There was a clear move above the 76.4% Fib retracement level of the downward move from the $66,587 swing high to the $58,943 low. More importantly, the price cleared a key bearish trend line with resistance at $66,200 on the daily chart, sparking bullish moves in altcoins such as Ethereum, Solana, and DOGE lower.
Bitcoin price is now showing a lot of bullish signs above $66,500 and $67,000. The current price action suggests that the bulls are back in action and might aim for more upsides.
Immediate resistance on the upside is near the $68,400 level. It is close to the 1.236 Fib extension level of the downward move from the $66,587 swing high to the $58,943 low. The first major resistance is seen near the $70,000 level. To continue higher, BTC price must settle above the $70,000 resistance zone.
In the stated case, the bulls might push the price toward the $71,250 resistance or the 1.618 Fib extension level of the downward move from the $66,587 swing high to the $58,943 low. The next stop for the bulls could be $72,000 or even a new all-time high in the coming weeks.
Another Rejection For BTC?
Conversely, Bitcoin price might struggle near $68,400 or $70,000 and start another decline. Immediate support on the downside is near the $66,000 level and the same trend line.
The first major support is near the $64,800 level. A downside break below the $64,800 support zone could spark bearish moves and dent the current bullish sentiment. In the stated case, the price might decline toward the 50-day simple moving average (blue) at $60,500. Any more losses could open the doors for a move toward the $58,500 support zone.
Overall, Bitcoin is signaling a crucial upside break above $66,500. If it plays well, BTC could continue to move higher toward $70,000 and then $72,000 in the coming days.
The post Bitcoin (BTC) Price Prediction: Will This Be The Bullish Breakthrough? appeared first on CoinChapter.

 At A Tipping Point – Will Resistance Give Way To A Major Surge?")