YEREVAN (CoinChapter.com) – Leading cryptocurrencies Bitcoin (BTC) and Ethereum (ETH) trended sideways on Dec 13, unable to break above their resistances.
As a result of the week-long sideways consolidation, BTC/USD exchange rate bobbed at just above $17,100, while ETH/USD stood at $1,270. Meanwhile, investors might see a sharp move on the ETH/BTC chart.
ETH/BTC is on the verge of a sharp break
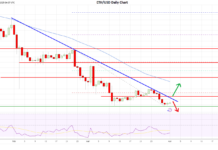
As CoinChapter noted in the previous ETH/BTC review, the daily chart printed two converging key trendlines: a dropping resistance and ascending support. The graph below shows the price action’s fluctuation between the two lines since mid-September.
Together the mentioned trendlines form a setup dubbed the ‘symmetrical triangle,’ which forecasts a sharp breakout in the direction of its previous trend. In rare cases, symmetrical triangles lead to trend reversals. That gives traders the price setup explained below.

ETH/BTC could either break above the resistance and shoot toward 0.09 (a 23% rally) or break below several supports and slump to 0.056, a 23% drop. However, investors need additional clues to forecast the more plausible direction.
Ethereum or Bitcoin for the win?
In times of turmoil and economic distress, most leading altcoins with considerable market caps tend to adopt the overall vector of Bitcoin’s fluctuations. Hence, macroeconomic factors might play a key role in determining the future power struggle between Ethereum and Bitcoin.
Investors expect the latest CPI report released within several hours, at 8.30 am ET on Dec 13. The report will focus on the November inflation data, shedding more light on the Federal Reserve’s possible actions.
Macro factors might play a key role in the Ethereum vs. Bitcoin balance
If Chair Jerome Powell implements more dovish policies in the upcoming year, the crypto market might finally decline and pull off a convincing upside move. If so, Ethereum will likely mirror Bitcoin’s bullish attempt with a higher price swing. Thus, ETH/BTC will pump higher, possibly reaching the target level of 0.09.
If inflation-curbing hawkish interest rate hikes continue, Bitcoin might slump lower while altcoins struggle to keep up, sending the ETH/BTC exchange rate to the lower target of 0.056.
As of the European session on Dec 13, both leading digital assets experienced considerable outflows from exchanges. The data below could be interpreted as a bullish sign for Ethereum and Bitcoin, as traders choose to keep their crypto rather than exchange it.

ETH is holding up well, says expert
Owner of MGH Alpha Chat, under the pseudonym @HypeManAlex, tweeted that Ethereum has been “actually holding very well” compared to Bitcoin. The analyst attributed the leading altcoin’s relative success to the NFT market and meme coins running on its blockchain.
HypeManAlex also noted that Ethereum could bottom out higher than the analyst expected, reversing the bearish course at around $400-600 rather than $300.

Considering all the factors noted above, the bullish scenario in the ETH/BTC charts seems likely.
However, Ether has several key resistance lines to conquer before reaching the target. The first one on the way will be the dropping upper trendline of the triangle. If bulls double down, increasing the buying pressure, the next resistance lines would stand at 0.075 and 0.078.
Click here to keep up with the ever-changing crypto market and never miss the scoop!
The post ETH/BTC on the verge of a sharp 23% move; what to expect? appeared first on CoinChapter.


